| This is a guest post from Ishan Jain, Senior Developer Experience Engineer at Grafana Labs, the company behind the open observability cloud. In this post, Ishan explores how the new Temporal Cloud integration for Grafana Cloud gives teams a simple way to visualize, monitor, and alert on the health of their Temporal Workflows. |
Operating Temporal Workflows at scale requires deep visibility into Executions, Task Queues, and capacity usage. The new Temporal Cloud integration for Grafana Cloud delivers that visibility in minutes with no extra infrastructure required.
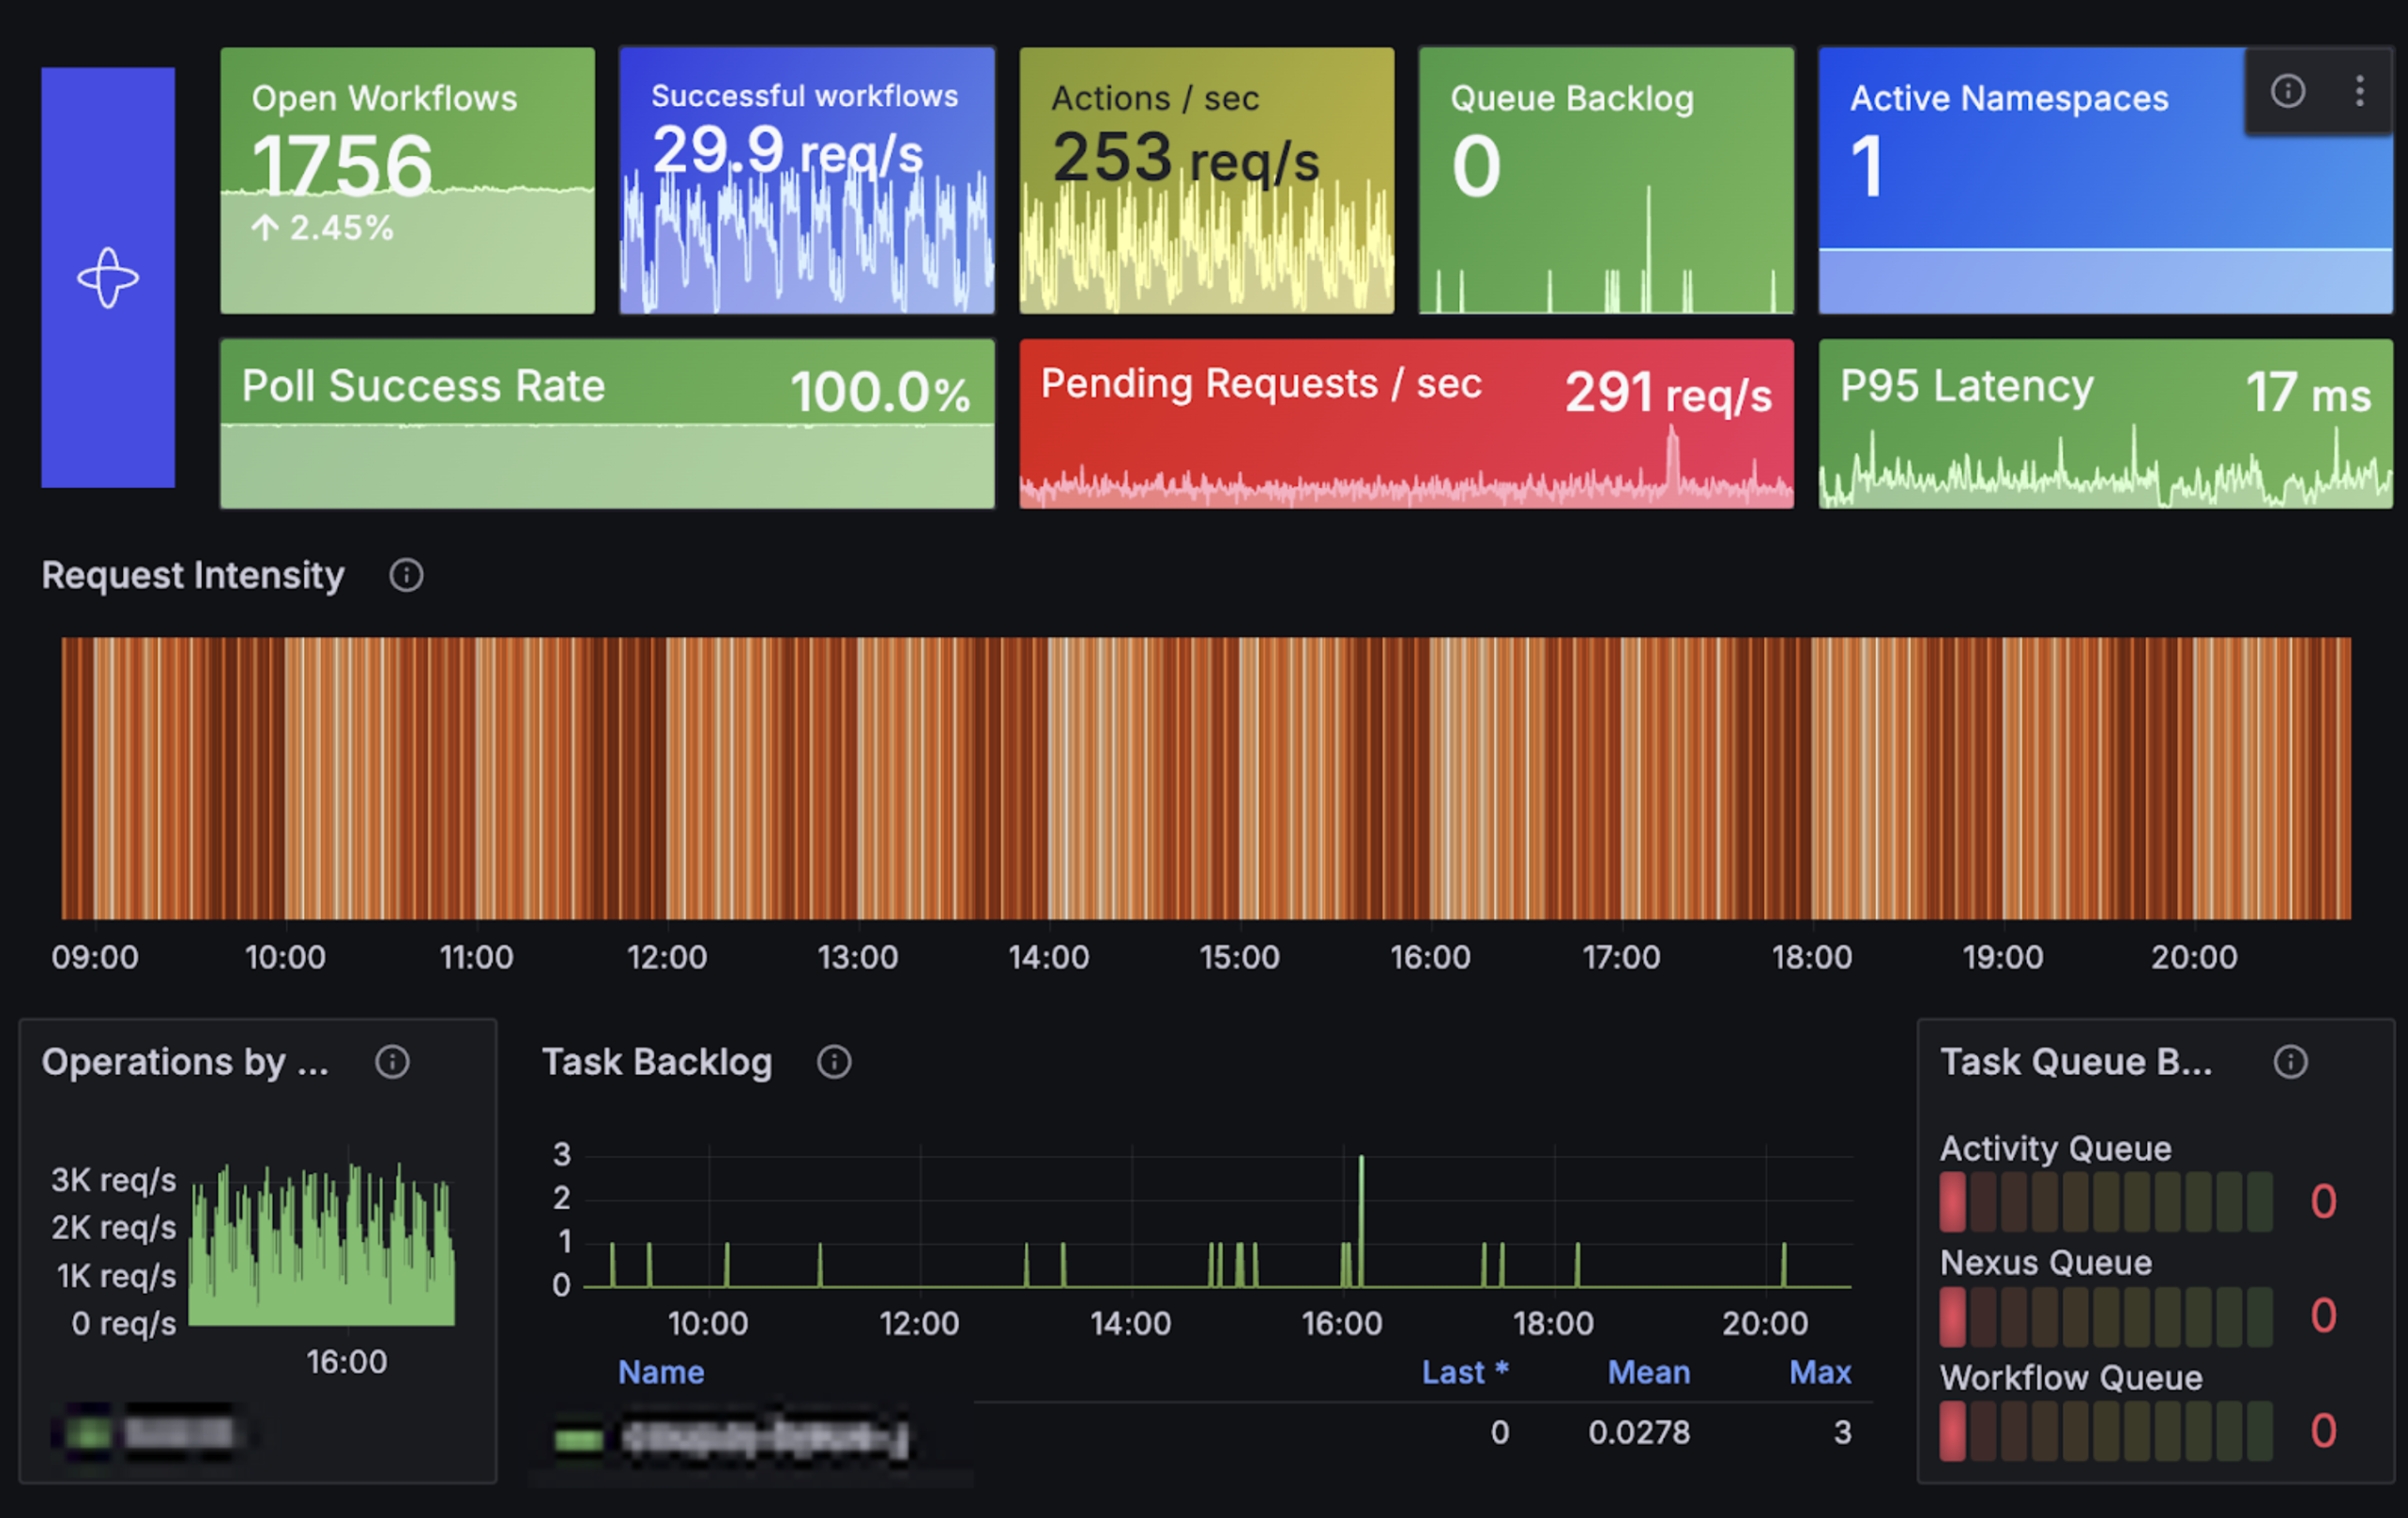
With Grafana Cloud, you get a fully managed observability platform that brings together metrics, logs, traces, dashboards, and alerts into a single experience. Now, by integrating Temporal Cloud metrics, you can visualize Workflow health, monitor Task Queue backlogs, track service latency, and uncover hidden bottlenecks, all using Grafana Cloud's powerful observability capabilities.
What you get#
Temporal Workflows generate high volumes of telemetry across multiple dimensions — such as Namespace, Task Queue, and Workflow type. This data is already available through Temporal Cloud’s OpenMetrics-compatible endpoint, but making sense of it typically requires teams to operate and maintain their own observability stack to collect, store, and visualize those metrics.
That’s where Grafana Cloud comes in. As a fully managed observability platform, it gives you a unified view of your Temporal telemetry, dashboards, and alerts — without the operational overhead.
With the new Temporal Cloud integration for Grafana Cloud, you gain:
- Expanded and improved metrics — including new dimensions like
temporal_task_queueandworkflow_type, accurate percentiles, and broader coverage. - A prebuilt, always up-to-date dashboard — purpose-built for Temporal Cloud to visualize Workflow performance, Task Queue depth, and usage trends at a glance.
- Cost control and noise reduction — via Grafana Cloud’s Adaptive Telemetry and metric optimization features.
- AI-assisted exploration — using Grafana Assistant, an AI-powered agent in Grafana Cloud, to query metrics, build dashboards, and troubleshoot in natural language. Together, these updates make it easier to understand what’s happening inside your Temporal Cloud workloads, helping you detect issues faster, optimize performance, and keep your system healthy at scale.

How it works#
The integration operates by periodically scraping metrics from Temporal Cloud’s OpenMetrics endpoint and pushing them into your Grafana Cloud Metrics instance. The integration runs entirely within Grafana Cloud infrastructure. All metrics are automatically labeled with your scrape job name, making it easy to organize and filter data across multiple environments or teams.
Setting up the Temporal Cloud integration in Grafana Cloud takes just a few minutes. You can learn more in Grafana Cloud documentation.

Next steps#
The integration is available now for all Grafana Cloud users. If you're already using Temporal Cloud, you can set up monitoring in just a few minutes by following the configuration steps above. If you’re ready to get started, check out the Temporal Cloud OpenMetrics documentation and the Grafana Cloud integration instructions.